


Introduction to Support and Resistance Indicators
Plotting support and resistance levels is crucial for identifying potential market reversals and capitalizing on trading opportunities. Manually identifying these levels can be challenging, but support and resistance indicators simplify the process, making it accessible for traders at all levels.
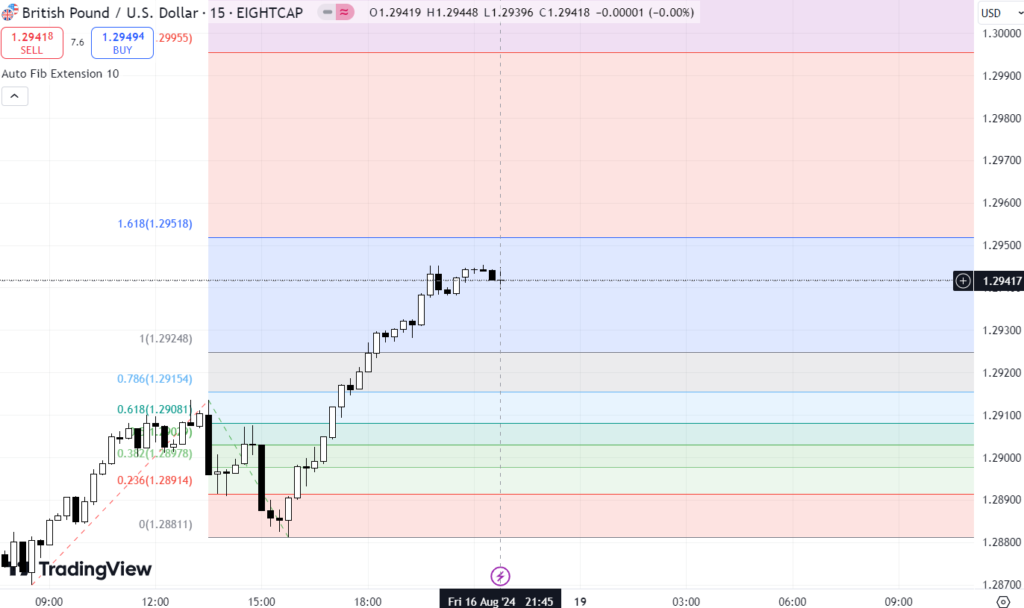
1. Fibonacci Retracement Indicator
The Fibonacci Retracement Indicator is a widely-used tool that plots horizontal lines at potential support and resistance levels based on key Fibonacci ratios (38.2%, 50%, and 61.8%). Ideal for trending markets, it helps traders anticipate where the price might reverse or continue the trend. By identifying significant swing highs and lows, traders can effectively utilize the Fibonacci tool to predict resistance in downtrends and support in uptrends.
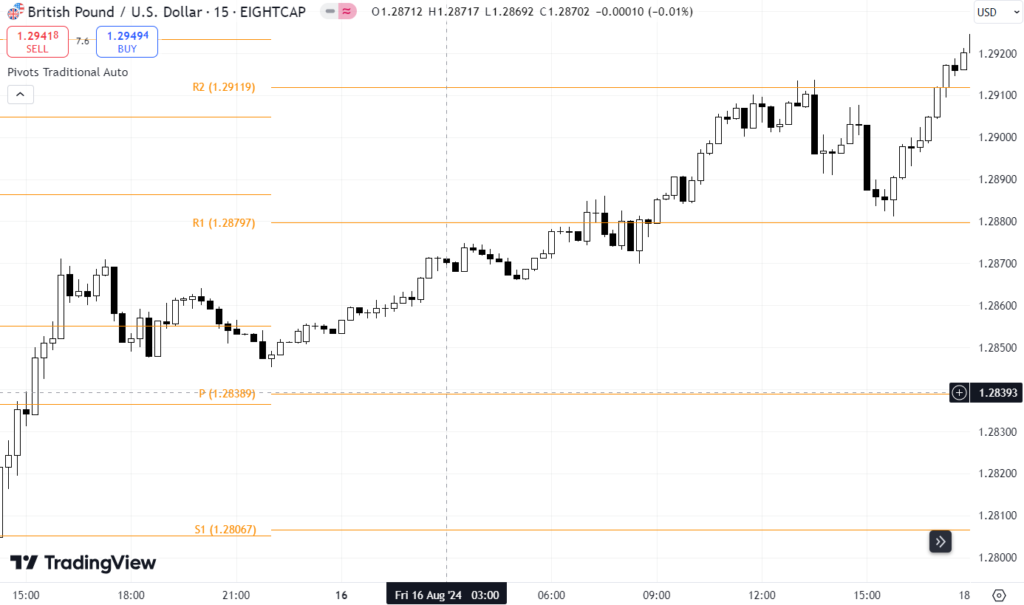
2. Pivot Points Indicator
The Pivot Points Indicator is a straightforward tool that calculates and displays potential support and resistance levels based on the previous day’s high, low, and close prices. It also provides insights into the market’s direction—trading above the pivot point suggests a bullish trend, while trading below indicates a bearish trend. This indicator is particularly useful for day traders looking for clear entry and exit points.
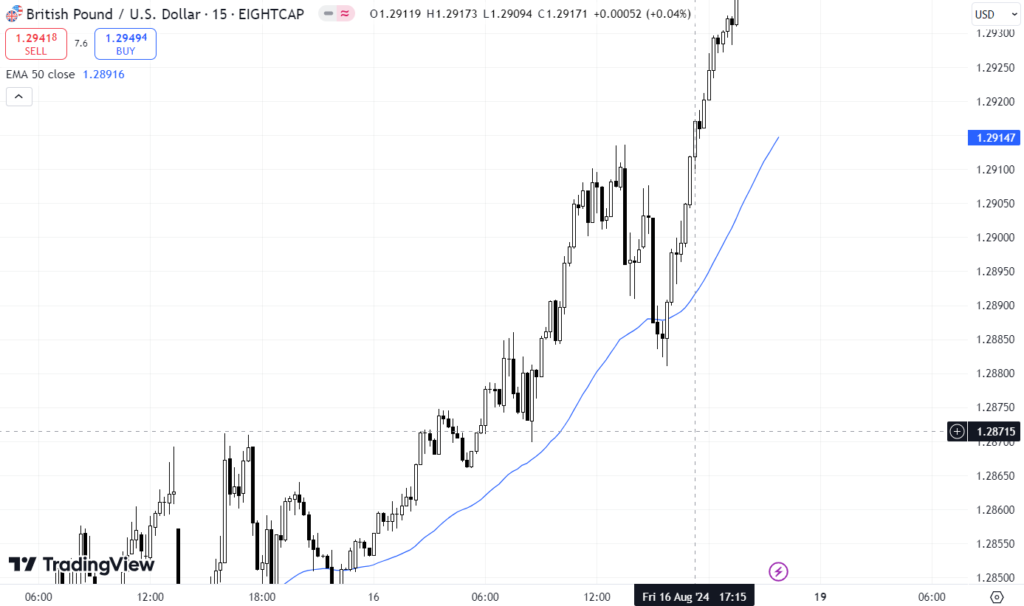
3. Moving Averages Indicator
Moving averages are commonly used to identify the overall trend, but they also act as dynamic support and resistance levels. When the price is above the moving average, it tends to act as support; when below, it serves as resistance. The Simple Moving Average (SMA) is particularly effective for traders looking to identify key levels where the price might bounce or reverse.
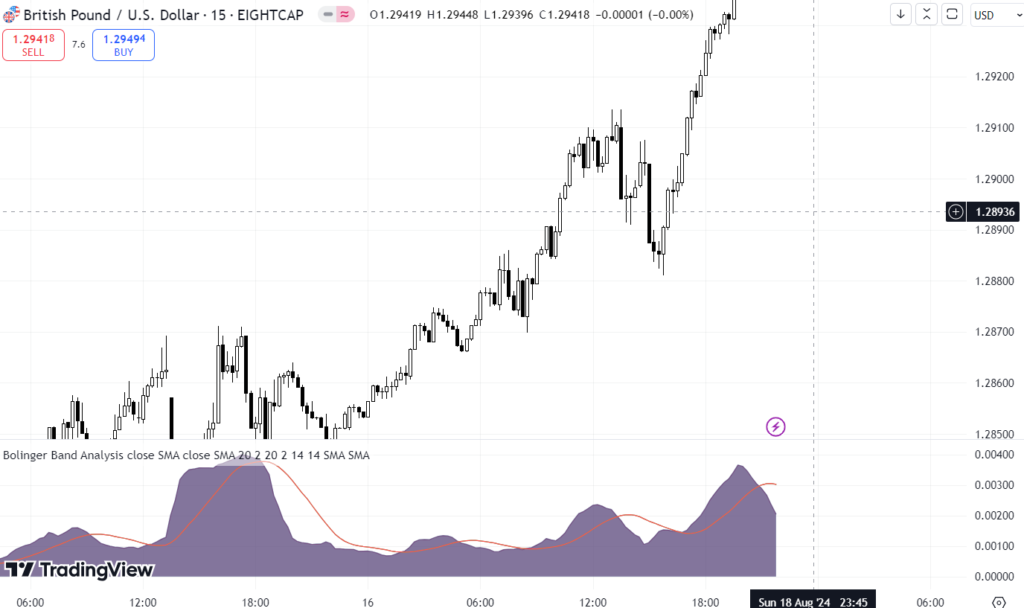
4. Bollinger Bands Indicator
Bollinger Bands combine moving averages and volatility bands to show potential support and resistance levels. The middle band, typically a 20-period moving average, acts as a dynamic level of support or resistance in trending markets. Traders can use Bollinger Bands to gauge the strength of a trend and identify potential reversal points.
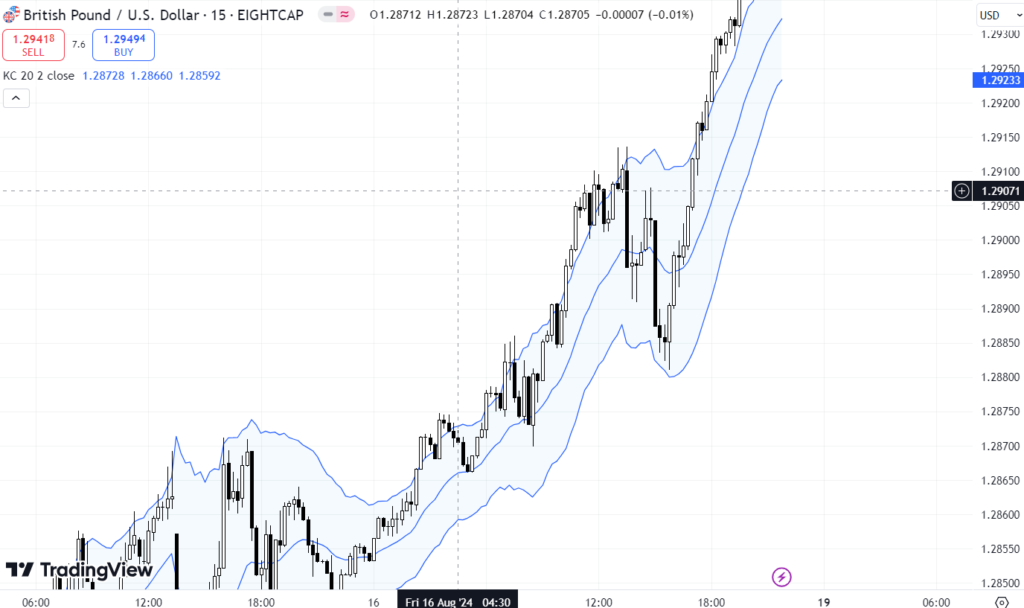
5. Keltner Channels Indicator
Keltner Channels work similarly to Bollinger Bands but use the Average True Range (ATR) to adjust channel width. These channels adapt to market volatility, with the middle line acting as a dynamic support or resistance level. In trending markets, traders can use Keltner Channels to identify key areas for entering trades based on the price’s interaction with the channel bands.
At Bro In Finance, we are committed to helping traders navigate the complexities of the forex market. Our in-depth analysis, expert insights, and advanced tools empower you to make informed decisions and achieve your trading goals. Whether you’re a beginner or an experienced trader, Bro In Finance is your trusted partner in mastering the forex market. Visit our website for more trading tips and strategies to enhance your trading experience.
Check out our on Best Forex Brokers to know more about this topic
Check out the most crucial steps that you need to take when choosing your forex broker
Have you heard about an amazing Broker Platform called “AVATRADE“? We at Bro In Finance do recommend this amazing broker.
Written by D Fernando


+ There are no comments
Add yours