If your a new trader that’s looking to conquer the forex, stocks, an futures, in this article you will learn very specific trading strategy that you can incorporate in your trading journey. Even if you are a experienced trader, you will be able to incorporate key strategies into your existing trading plan. which would in return will increase your trading success.
This will give out a complete trading plan from entry to exit, most the trading strategies covered in other articles are complete nonsense, it would present you with carefully curated examples that shows, ‘ you could have bought or sold here, and taken a profit from here. Don’t believe in this nonsense period!!. There is no traders called aggressive traders or conservative traders. There is only one trader who follows a trading plan with a set probability or don’t. It is very simple as that.
These are the key factors we believe in that is momentum, pattern, price and time. Then to use and recognise key relevant market information to make informed decision according to your trading plan.
The objective of your trading plan is to find out high probability trading entry with a very specific entry point. you will be able to use these strategies in any market and any time frame without any restrictions. which is very similar to natural environment, farming, do you seed in winter? no right?!. Don’t this the market as hydroponic farm that you can plant and harvest throughout the year. Just think indoor farming and hydroponic farming as HFT trading where they trade 24 hours!. which is not possible without a direct link to the exchange. let’s put the analogies aside.
The first strategy is based off the Momentum using Multiple Time Frames
You can fill your tradingview chart with multiple momentum indicators, such as MA(20), MA(50), MA(200). or even trendlines. However, non of these indicators will help you to figure out the beginning stages of the price actions which why it is easy to say, ‘ i should have bought or sold here’ after the price movement. We will cover how you can use these indicators in a very logical way, that would help you to find out early stages of trend and avoid entering into the later stages of the price movement.
This is very important to understand before we move on
‘ Momentum indicators represent momentum trends, not price trends’
In order to figure out the trend, there are three aspects need to fulfilled, which are time, price and the position of the market.
We have applied the dual time frame momentum to GBPUSD currency pair using 60 mins and 15 mins charts, This is a quite simple strategy but powerful if you used it correctly and most importantly with greater patience.
Strategy:
Trade in the direction of the momentum of the larger time frame and use the smaller time frame enter trades in the direction of the larger time frame, but only enter to the market when there is a trend reversal in the smaller time frame.
Here are the indicators that you need
- DTOSC ( Robert C. Miner’s DT Oscillator) 13,8,5,5
- EMA 200 (Exponential Moving Average)
- Pivots Traditional
Day Trading Setups
- 60 Min Chart (1 hour Chart)
- 15 Min Chart
There are 4 rules you need follow when using this trading strategy,
| Higher Time Frame Evaluation | Smaller Time Frame Evaluation |
| 1. Bullish in the Overbought (Above 80) | No new Buy Trades |
| 2. Bullish (below 20 or above 20 and increasing) | Buy Trade following a reversal below 40 |
| 3. Bearish in the Oversold (Below 20) | No new Sell Trades |
| 4. Bearish (above 70 or below 70 and dropping) | Sell Trade following a reversal above 60 |
I know its bit complicated because of the bearish and bullish wording and the different zones pricing
I will give example for each cases clearly explaining the each rule so you can get a clear idea about it, make sure if you want you can trade all day using this strategy but i advice to put only two trades per day, so you are not risking too much per day. We will cover the risk management in a different article.
The use case of the pivot point is to determine the exit points of a trade where it is a short or a long trade, that doesn’t really matter.
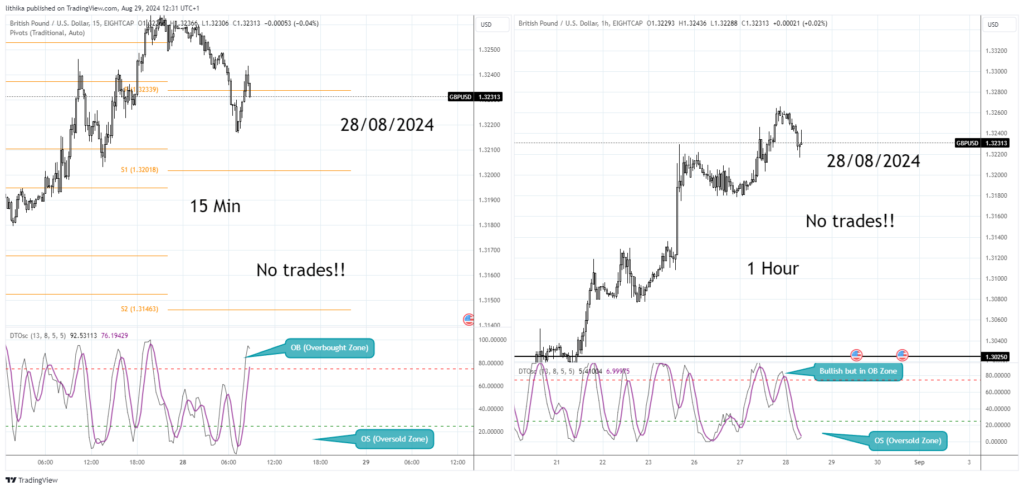
Let’s take look at the first example to illustrate the First Rule
| Higher Time Frame Evaluation | Smaller Time Frame Evaluation |
| 1. Bullish in the Overbought (Above 80) | No new Buy Trades from reversal |
Rule 01

Let me repeat the rule, if the momentum in the higher time frame, in this case 1 hour is at the over bought zone(OB), and the if the momentum in the smaller time frame in this case 15 min is at the over sold zone(OS). There will be NO TRADES!!!.
RULE 02
| Higher Time Frame Evaluation | Smaller Time Frame Evaluation |
| 2. Bullish (below 20 or above 20 and increasing) | Buy Trade following a reversal below 40 |
Example from 28th August 2024

As from the example extracted to show the rule 2, example had been taken from GBPUSD in 28th August 2024. If you check the 1 hour chart on the right, which is the higher timeframe, the momentum is at below the 20 level, indicating a significant over sold zone. And if we look at the chart of the left side which is the smaller timeframe shows that the price had reached the oversold zone, which is a clear signal that we can enter a long trade.
The trade we had took was had a R:R of 1:1.5,
Entry: 1.31797
SL: 1.31579
TP: 1.32133
Here is an reply of how the trade would look like, if you had taken it.
If you would have taken, the trade it would have been a profitable trade, of course all the trades are not going to be profitable but we are looking to get at least 70% of the trade to be profitable.
With this trading strategy we believe, the maximum risk to reward you will be able to obtain would be 1:1.5, so there is meaning full distance based of the volatility of the market. which can be selected based off the ATR indicator. We believe 20-25 pips to the SL and TP 30-35 pips is ideal with GBPUSD, which of course would change upon the liquidity and volatility of the market.
RULE 03
| Higher Time Frame Evaluation | Smaller Time Frame Evaluation |
| 3. Bearish in the Oversold (Below 20) | No new Sell Trades |
Let me explain this rule clearly, if the momentum in the higher timeframe is below 20, meaning it has been oversold by the market, and in the smaller time frame, there is a bearish reversal is forming, even if that’s the case there will be NO TRADE!!!. I say that again NO TRADES!!.
Here is an example that illustrate the above rule clearly.

If you look on the right side which is the higher timeframe, the momentum is at the oversold zone, and if you look at the right side, price is at the overbought zone each contradict the other, in this case there will be NO Trades!!. I know its complicated but you need to practice to master this skill which is why you need get the premium version of the trading view which can be purchase from this link -> Tradingview
RULE 04
| Higher Time Frame Evaluation | Smaller Time Frame Evaluation |
| 4. Bearish (above 70 or below 70 and dropping) | Sell Trade following a reversal above 60 |
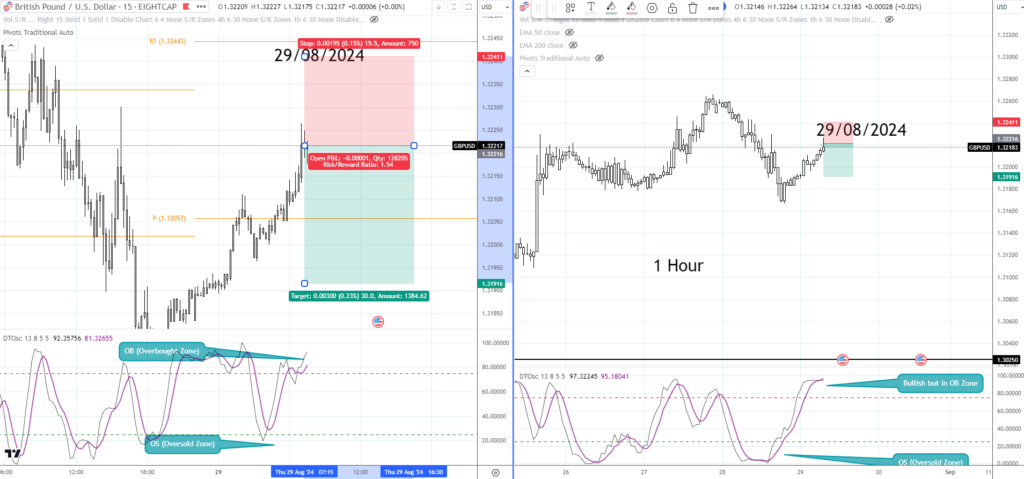
Let me explain this rule in simple terms, if the momentum in the larger time frame, is above 70 over, dropping from 70 and in a downward trend in the momentum indicator window. and you can clearly see a reversal trade in the smaller time frame and its at the overbought zone, meaning the both the higher timeframe and smaller time frame aligned in the same direction, Now you can enter a sell trade ( short trade).
Here is an illustration of the above rule 4 using GBPUSD trade and you will be above to see if this trade going to be profitable one.

As from the example, on the right side, in the 1 hour timeframe, the momentum is above 70 and in the left side in the 15 min chart you can clearly see the price above 70, so both the higher timeframe and smaller timeframe are aligned perfectly to each other, which would give a us a signal to place a short trade (Sell trade).
Here is the summary of the trade with a R:R of 1:1.54
Entry: 1.32216
SL: 1.32411
TP: 1.31916
Lets have a look what would have had happen if we would have taken this trade.
As from the evidence, you would be profitable, make sure to remember, trading is all about the probability and ability to enter to the market at the correct time and exit with you preplanned conditions. The risk management is is very crucial. You should aim for 70% of the trades to be profitable and you should be we consistent of how you trade.
Based on the evidence it is clear Dual Time Frame Momentum Strategy is profitable and logically sounding. When trading this strategy we use a machine learning model to determine the exits and direction of the trade and positioning of the trades.
Check out our on Best Forex Brokers to know more about this topic
Check out the most crucial steps that you need to take when choosing your forex broker
Have you heard about an amazing Broker Platform called “AVATRADE“? We at Bro In Finance do recommend this amazing broker.
Disclaimer: Forex trading carries significant risk and may not be suitable for all investors. This analysis, based on Bro In Finance’s proprietary data, is provided for informational purposes and should not be considered investment advice.
Written by L Ranepura


