The objective of pattern recognition
- It will help you to figure out if the market is in a trend or correction
- Ascertain if the trend or correction near completion
- forecasting of what will happen after the completion of the trend or the correction
In this article help you understand if the market indicates a completion of a trend or correction. By the end of this article you will have the confidence to get of the trend during the correction phase of the trend in the forex or stock market.
A frequent type of correction for all markets and all timeframe, you will find three swings, which is called ABC, we believe correction phase of a trend should include at least have three distinct swings.
This is very important, A correction will have more than three swings but we are looking for the first three swings.
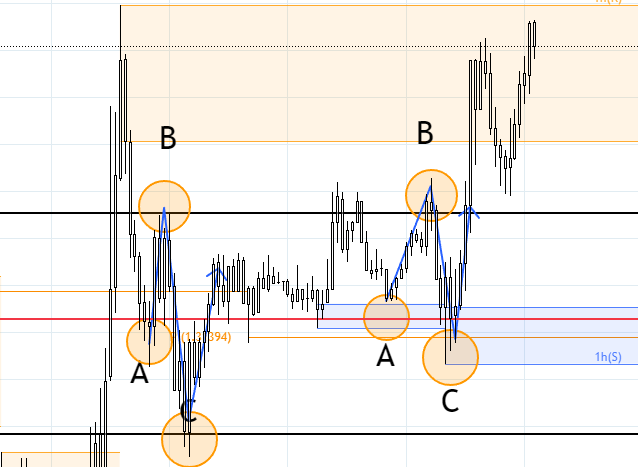
Here is an example of a three swings, for buy setup breakout and continuation of the trend

As for above description of it, we can clearly see the market is in a correction phase, but it you can use the ABC breakout strategy to figure out completion of a correction phase, you have a higher probability of making a large enough profit. Always look for at least three sections.
Here is the ABC guideline for a BUY setup
- The “C” wave should exceed the “A” wave.
- If the market trade back into the A price level which has been indicated by the red line, the minimum conditions for a correction are completed.
- A trade beyond the wave b extreme indicates the correction is completed and it will be looking to breakout from the range to a new high.
if you look the image close enough, you will see two same type setup, you might think from the first overlap there will be a breakout, but you would be wrong, in this breakout there are two identical overlaps but even if you enter on the first overlap you won’t lose money so risk is low. When trading these patterns you have to have large enough capital to manage the drawdown.
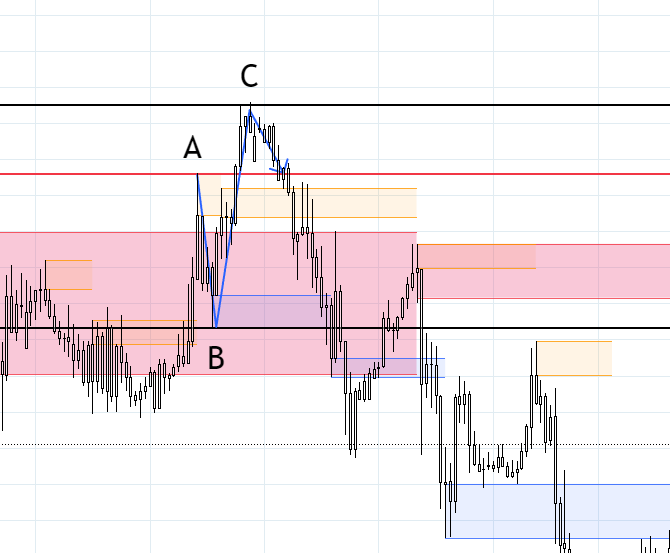
Now that we have covered the ABC guideline for buy, here is the ABC guideline for SELL setup

The GBP/USD was in a trend for the past couple of days and desperate for a correction, but identifying a correction or a completion of a trend is equally important to make a high probability informed decision based on your trading plan for the day. according to ABC guideline, the price makes the first time indicated by the “A”, then it rejected and price come back down and makes a new low which is indicated by the “B”, with the buying pressure it moves pass the previous high of “A” but it get rejected and comes back down to the “A” level which is indicated by the red line. In this case the minimum condition for a correction is completed. When the price come back down to the “B” level, the trend continuation is completed.
You can trade the SELL setup when the price retest the level of “B extreme or you can take the trade when the price drop below the “B” extreme its up to you, how you trade but make sure to trade with a trading plan with a high probability.
I have simplified a very complex trading strategy written by Robert C Miner, you can Buy his book from Amazon using this link -> https://amzn.to/3Xu3izv
You can trade these very simple strategy in any market at anytime, but you need to find what market is best for your trading psychology and your routine. Make sure that you can clear trading plan with tested probabilities.
Check out our on Best Forex Brokers to know more about this topic
Check out the most crucial steps that you need to take when choosing your forex broker
Have you heard about an amazing Broker Platform called “AVATRADE“? We at Bro In Finance do recommend this amazing broker.
Check out here to figure out the best funded trader program: Which Funded Challenge is Best
Disclaimer: Forex and stock trading carries significant risk and may not be suitable for all investors. This analysis, based on Bro In Finance’s proprietary data, is provided for informational purposes and should not be considered investment advice.


